Understanding the stakes: a guide to Digital Operational Resilience Act’s penalties
Discover the implications of non-compliance with the EU’s DORA. Learn about the stringent penalties, the responsibility of financial entities.

Decoding PCA: transforming data for efficient dimensionality reduction.
The Principal Component Analysis (PCA) algorithm identifies new perspectives (or axes) for datasets, making it more straightforward to segregate and cluster data instances. It generates as many axes as dimensions in a given dataset by design. However, these directions, known as Principal Components (PCs), are ranked based on their significance: the first PC captures the maximum possible data variance, the second one accounts for the second-largest variance, and so on. Once the initial data has been projected into this new subspace, we can eliminate some of the axes. This process reduces dimensionality while preserving most of the crucial information.
This article aims to demystify a fundamental technique used extensively in probability and statistics for dimensionality reduction factor analysis – PCA. Interestingly, PCA is not a dimensionality reduction method in the strictest sense, even though it is often portrayed as such. In reality, it modifies data specifically, preparing it for subsequent reduction.
Before using PCA, we must standardize our dataset. The method will not work if we have entirely different scales for our data set.
Standardization helps to avoid biased outcomes.
For example, suppose there are three variables – v1 in a 1-10 range, v2 in a 10-100 range, and v3 in a 100,000 to 1,000,000 range. Let us go ahead and compute an output using these original variables as predictors. We will get a heavily biased result because the third variable will disproportionately impact the output value.
Before applying PCA, we must ensure that all our attributes (dimensions) are centered around zero and have a standard deviation 1.
Now, we can calculate our first principal component.
Imagine this is the dataset on which we are trying to do cluster analysis; we only have a data matrix with two dimensions.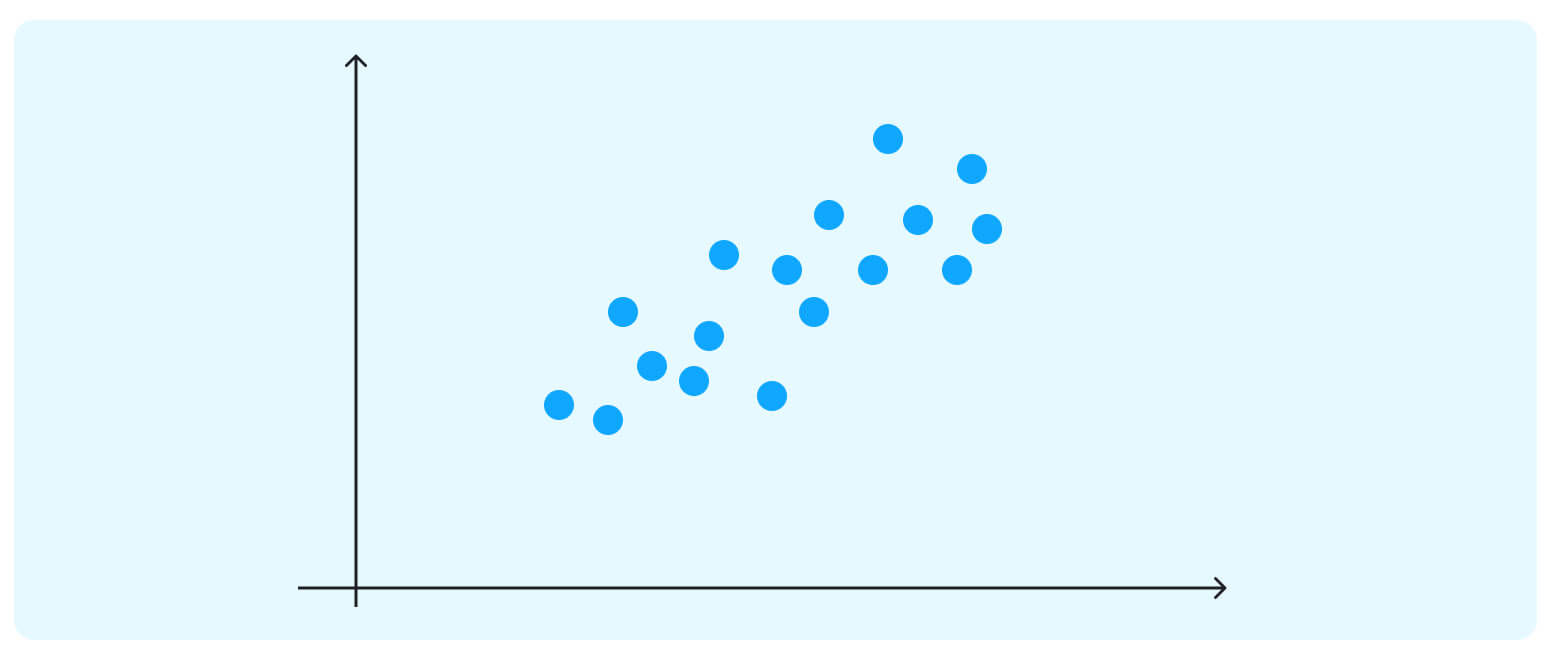 If we project the data onto the horizontal axis (our attribute 1), we will not see much spread; it will show a nearly equal distribution of the observations.
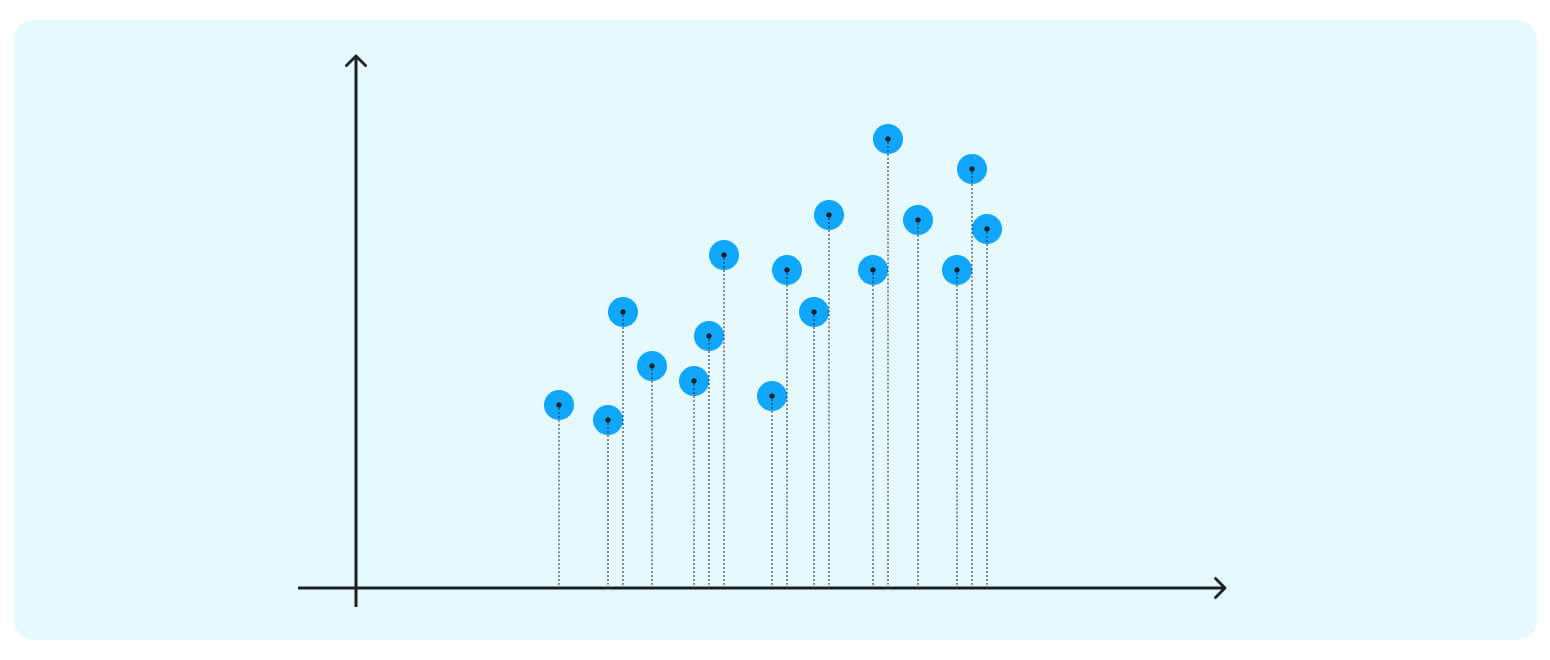 Attribute 2 could be more helpful too.
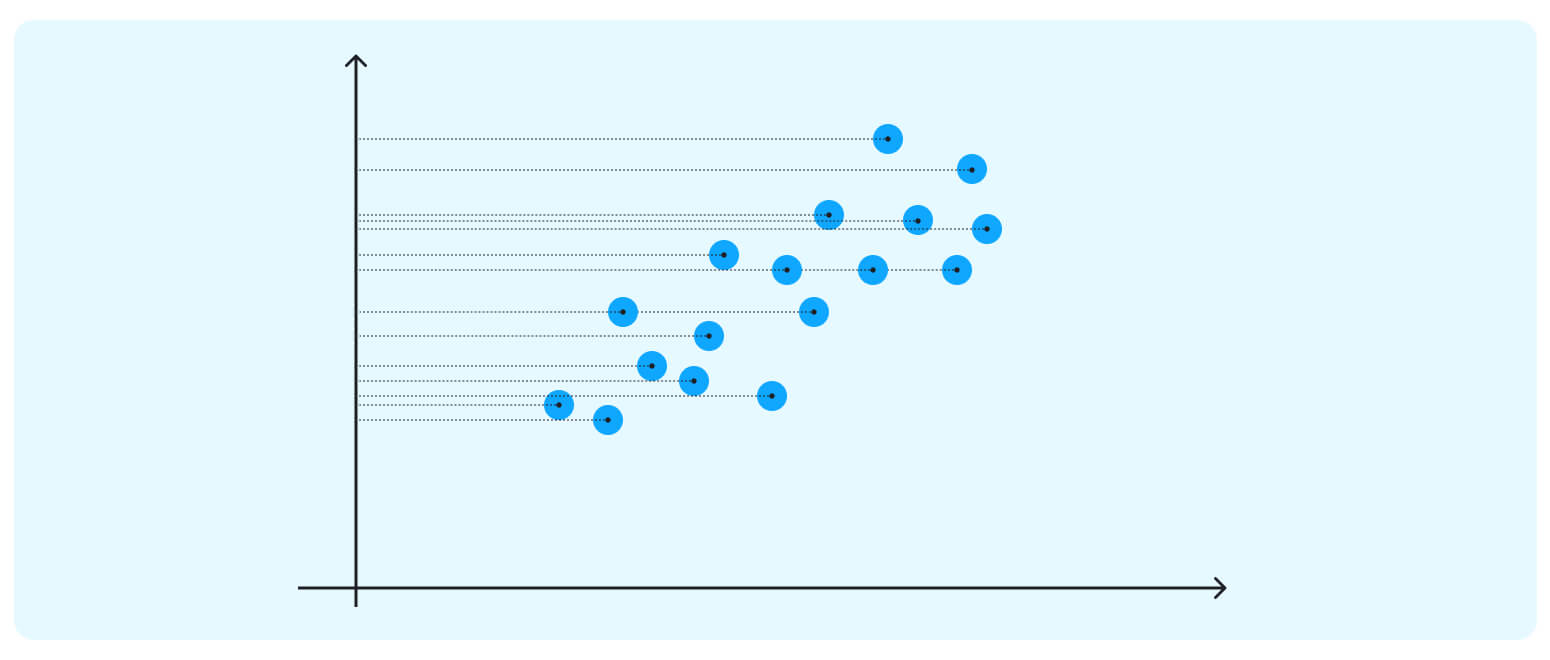 The data points in our case are spreading diagonally, so we need a new line to capture this better.
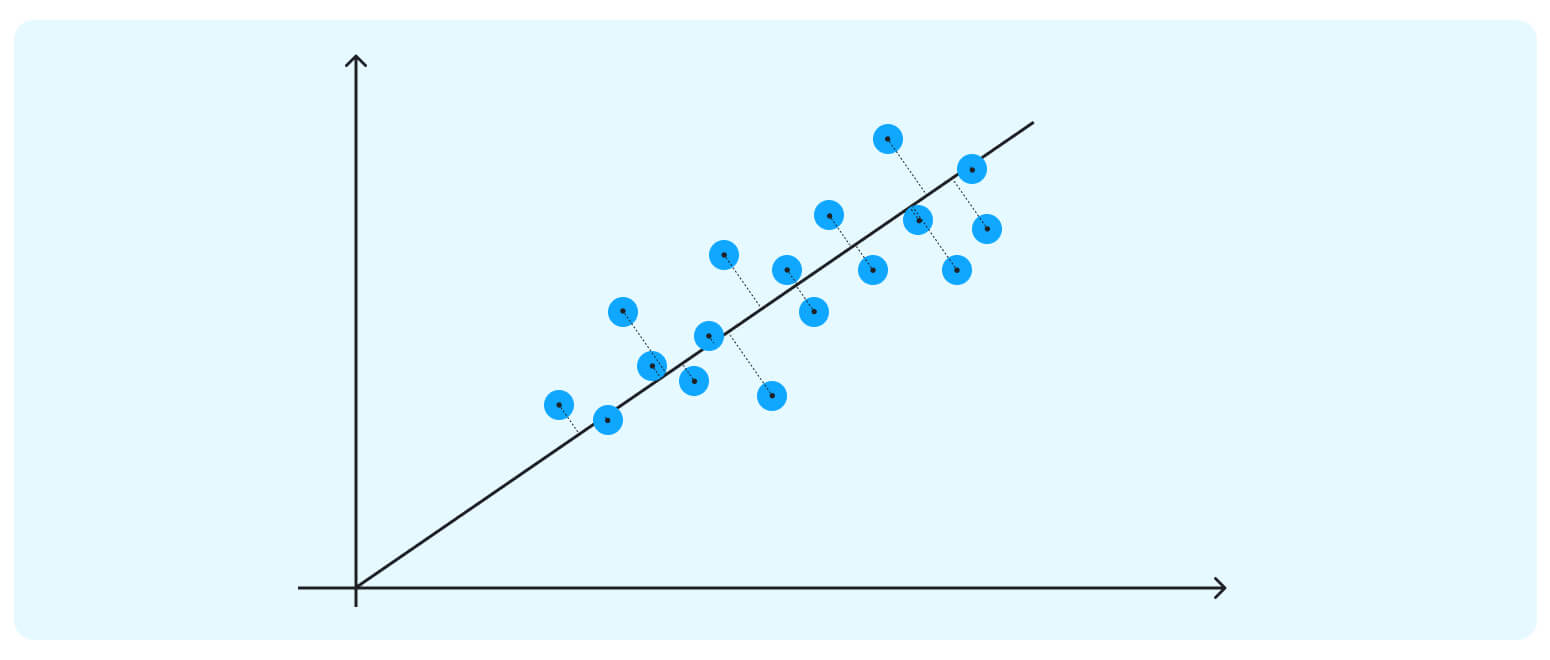 This axis is our first PC – a new direction (we can think of it as an attribute) that maximizes the total variance out of the whole data point (and thus, the clusters become much more apparent.) Besides maximizing the spread, this first PC sits through the direction of the data, minimizing the distances between all the points and the new axis.
The second PC must represent the second maximum amount of variance; it will be an orthogonal line to our first axis. *Due to PCA’s math being based on eigenvectors and eigenvalues, new principal components will always come out orthogonal to the ones before them.
**Eigenvectors are vectors that are not knocked off their span by a linear transformation; they can hold on to their original direction while being stretched, shrunk, or reversed by linear combinations. Eigenvalues are factors by which these particular vectors are scaled.
If we have a few data columns, we first calculate the means for all of them.
Then, we center the values in each column (to do so, we subtract the mean column value) and calculate the covariance matrix for the resulting centered matrix.
*Covariance is a statistical measure of an unnormalized effort that indicates the direction of the linear relationships between two (positive or negative) variables. A covariance matrix is a linear combination of a covariance calculated for a given matrix with covariance scores for every column with every other column.
Next, we utilize one of the methods for breaking up matrices (eigendecomposition or singular value decomposition) to turn our matrix into a list of eigenvectors that will define directions of axes in the new subspace and eigenvalues that will show the magnitude of those directions.
We sort the vectors by their eigenvalues in decreasing order and thus get a ranking of the principal components.
That is it. Now we can ditch some dimensions and project our initial dataset into a reduced subspace without losing essential information about the original dataset. And since new axes capture the maximum variance in the original data, any clustering algorithm we will apply next will have an easier time grouping the data instances.
PCA is used extensively for data analysis in business and academia. The method (typically paired with other Machine Learning (ML) models) has helped data scientists achieve impressive results in time-series prediction, data compression, and data visualization tasks.
It is generally used in finance for financial risks, quantitative analysis only, exploring and dynamic trading strategies, statistical arbitrage, and financial and stock market price prediction.
Stock price prediction is based upon the assumption that market patterns recur over time and further analysis that stock prices are always tied to several macroeconomic variables and fundamental variables such as book-to-market ratio and earnings yield, which could be examined for predictive purposes.
There is also a significant body of research suggesting price predictions could be generated from the historical price/return data, and this particular study introduces a robust general prediction method for stock price values that relies on covariance information.
Typically, ML experts use conventional maximum likelihood estimators to approximate covariance matrices or, in some specific cases, empirical covariance. However, both of these methods fail in situations where the dimensionality of a matrix is enormous compared to the number of variables.
To remedy the problem, various shrinkage estimators have been proposed, such as the one described here – invertible and well-conditioned (inverting it does not result in error amplification).
The method employs PCA for stock pricing forecasting. It is similar to subspace filtering techniques that use orthogonal decompositions of noisy data spaces onto noise and signal subspaces.
The researchers used stock price data from General Electrics and five other companies for their experiments. They transformed the resulting dataset into 15 Hankel correlation matrices of various lengths which enabled them to test how much impact the length variable has on the estimation power (their technique for normalizing and centering correlation matrix of the empirical is described in detail in the paper.)
Though Gauss-Bayes multivariate conditional mean is thought of as an effective tool for minimizing the mean squared error (and is, therefore, a good choice for an unbiased future value estimator), it does not produce accurate numerical results when dealing with a covariance network that is not well-conditioned. The authors implemented a filtering operation based on Principle Component Analysis to fix this.
Projecting the data onto the principal subspace, according to the paper, cuts the problem’s dimensionality and substantially improves its condition number. The algorithm achieves a better out-of-sample performance than the multivariate conditional mean (in terms of directional change statistic and the mean squared error). It is, therefore, an excellent substitute for Gauss-Bayes.
Also, as opposed to the Gauss-Bayes, this easily implementable method does not turn unreliable when dealing with ill-conditioned covariance matrices; it can be used for estimating future price values utilizing a multitude of predictors.
PCA is a well-established mathematical technique for dimensionality reduction. Data scientists apply it to complex datasets to make them more amenable to clustering or other ML tasks.
In this post, we have provided a high-level description of the method (to make its logic more accessible) and an exciting example of how PCA could be used for a real-world, serious financial analysis or data mining task.
Contact our experts for a free consultation to learn more about the algorithm and how your company can leverage its properties to achieve high-value business outcomes.

Discover the implications of non-compliance with the EU’s DORA. Learn about the stringent penalties, the responsibility of financial entities.

A deep dive into the changing world of banking cloud security. Find the balance between innovation and security.

Discover how Artificial Intelligence (AI) and Machine Learning (ML) are changing the code of credit risk management in banking.

Download the whitepaper to assess your DORA readiness and understand the intricacies of the regulation.

Discover the latest banking technology trends and as well as tips on how to capitalize on them.

Dive into the transformative trends shaping the FinTech industry in 2024. Discover how new tech redefines the future of financial services.

Dive into the insurance industry’s future with our comprehensive guide on the top 10 technology trends for 2024.

Discover the key automotive trends for 2024 and learn how to capitalize on new opportunities.
Ready to innovate your business?
We are! Let’s kick-off our journey to success!